

Marketing
Every client has their own Analytics property, Search Console site, Ads account and rankings project, and they all live somewhere else. The marketing module links them to the client in schakl., pulls the daily figures overnight, and shows them where the rest of the client record already is. A measurement profile per client turns them into a leads dashboard, and below it sits how often AI answers mention the client’s brand.
Where to find it
Section titled “Where to find it”- Marketing in the main menu: pick a client at the top and you get exactly the same dashboard as on the client itself.
- The Marketing panel on the client page, with a link above it to that client’s full marketing tab.
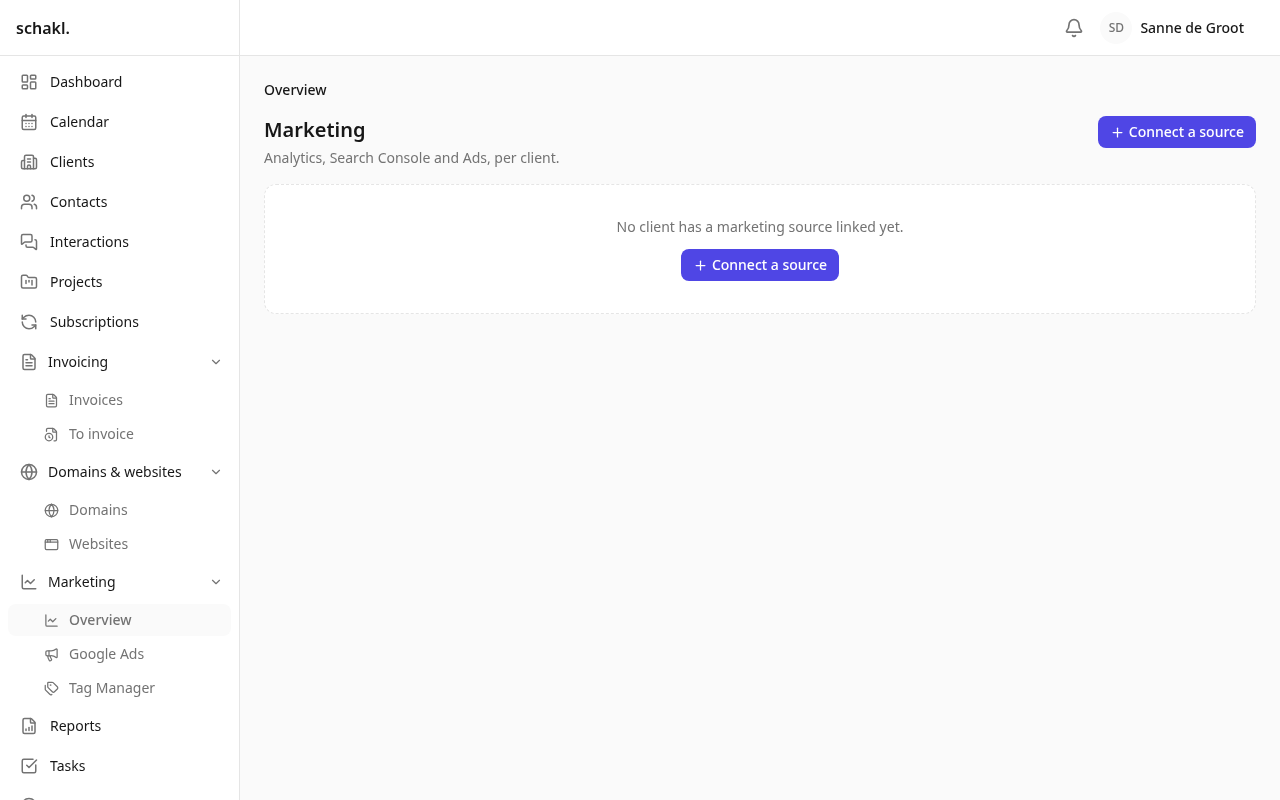
- Overzicht → Marketing (Overview → Marketing): one row per linked client.
- Instellingen → Marketing (Settings → Marketing): the Google Ads developer token, the SE Ranking API key (and optionally a separate Data API key), the default comparison, AI visibility, the channel grouping and Namen van bronnen (source names).
Marketing is a licensed module; switch it on under Instellingen → Modules. See Licences.
Setting it up
Section titled “Setting it up”-
Switch on the Google Workspace module and enter your own Google Cloud project’s OAuth client under Instellingen → Google Workspace. In that same project, enable the APIs this module calls: both the Google Analytics Admin API and the Google Analytics Data API (the Data API alone leaves the property picker empty while everything else looks configured), the Google Search Console API and the Google Ads API.
-
Under Instellingen → Marketing, enter the Google Ads developer token (created in the API Center of your Google Ads manager account) and, if you use SE Ranking, the SE Ranking API key. Sleutel controleren (check key) costs nothing and says per API whether the key gets in.
-
Connect your own Google account: Instellingen → Mijn account, card Google-account, button Google koppelen. If you hold the permission to manage marketing links, the marketing scopes are part of that same consent: one trip through Google’s screen, not three.
-
Open a client and choose Bron koppelen (connect a source; on the marketing tab, or with the + on the client page). Pick an account per source: Analytics-property, Search Console-site, Ads-account, SE Ranking-project or Rank Math-merk, and optionally the Tag Manager container. If the client has several websites, first choose under Koppelen aan website which site the link belongs to, or leave it on Hele klant (whole client).
-
For the leads dashboard: click Meetprofiel instellen (set up measurement profile) on the marketing tab (see below).
A missing Google connection does not block the other sources: an SE Ranking project or a Rank Math brand links fine without a Google account. If something is still missing in the client’s WordPress site for Rank Math, the picker shows a checklist naming the missing step, with a button to the right place in wp-admin.
What the dashboard shows
Section titled “What the dashboard shows”One row of KPIs per linked source, with the change and the figure it was measured against, and a sparkline. At the top you pick the period: Laatste 30 dagen (last 30 days), Deze maand (this month), Vorige maand (last month), Dit kwartaal (this quarter), Laatste 90 dagen (last 90 days), Laatste 12 maanden (last 12 months), a month or quarter through Andere periode, or an Eigen periode (custom span) with Van and Tot en met.
| Source | Metrics |
|---|---|
| Google Analytics | Sessions, Users, New users, Key events, Conversions, Engagement, Revenue |
| Search Console | Clicks, Impressions, CTR, Avg. position, and impressions in AI after an upload (see below) |
| Google Ads | Spend, Clicks, Impressions, Conversions, Conversion value |
| SE Ranking | Avg. position, Top 3, Top 10, Top 30, ranking and tracked keywords |
Under each source sit the drilldowns: top pages, channels, devices and key events per event from Analytics; top queries, top pages and biggest movers from Search Console; campaigns from Ads; keywords, the site audit and AI search results from SE Ranking. They are fetched from the source and kept for a day, and early every morning a job reads every client’s tab the way a colleague would open it. Whoever starts at nine does not wait on Google.
Compared with last year, and it says so
Section titled “Compared with last year, and it says so”By default every figure compares with the same period last year, because seasonality makes a comparison with the month before meaningless. The screen says so in words, with the dates: “vergeleken met dezelfde periode vorig jaar (23 aug – 21 sep 2025)”. Under Instellingen → Marketing you can set the default to Vorige periode (previous period), and a client’s dashboard may differ (Vergelijken met). The cross-client overview deliberately uses the same comparison for everyone.
The leads dashboard
Section titled “The leads dashboard”Above the sources sits Leads en formulierinzendingen (leads and form submissions): the questions an agency used to build per client in a Looker Studio report, as one fixed catalog. What differs per client lives in that client’s Meetprofiel (measurement profile):
- Event roles: which GA4 event is, for this client, a request, form started, form submitted, form error, phone click, e-mail click or application (exact, begins with, contains or regex).
- Dimensions: the GA4 fields the dashboard may group by, such as the client’s own service
parameter, with a label per value (
internationaal-transport = Internationaal transport) and whether it is offered as a filter. - Form types that count as a quote, the Google Ads conversion actions with their service, and the measurement breakpoints: the dates the measurement changed.
The editor reads event names, dimensions and conversion actions from the client’s own property and Ads account, so nothing is typed from memory. The dashboard then shows, among others, requests, quotes, phone and e-mail contact, requests per service, where they came from, which page, started versus submitted, failed submissions per page, and an advertising half with cost, conversions and missed ad impressions per campaign.
- A click on a filter chip or a row filters the whole page through the URL: a filtered dashboard is a link and the back button undoes the click.
- A widget the profile cannot answer does not appear as zero but under “onderdelen niet getoond” (widgets not shown), with the reason.
- A sampled GA4 answer, thresholding, a dimension not registered in GA4, or a week with traffic and not a single request sits beside the figures as a warning.
- GA4 events and ad costs are never joined on a date. A conversion value is a bidding value, not revenue, so there is no ROAS.
Visibility in AI answers
Section titled “Visibility in AI answers”Zichtbaarheid in AI-zoekmachines (visibility in AI search engines, below the sources) comes from SE Ranking’s AI Search figures: brand mentions, links to the site, average position and AI opportunity traffic, across ChatGPT, Perplexity, Gemini and Google’s AI Overviews and AI Mode. It always shows last month against the month before, with a six-month chart.
Every read spends units of your own SE Ranking Data API plan, so it is off by default. Switch it on for one client (Inschakelen voor deze klant) or for everyone, and the price is on every control that spends units. A month is read once and stored. Brand, domain, country database and engines are set per client, with the house setting as the default. SE Ranking issues one key per API; if your Data API runs on a different key, enter it as the SE Ranking Data API key.
Zichtbaarheid in AI-overzichten en AI-modus is Search Console’s Generative AI report. Google shows those figures in Search Console but returns them through no API, and the card says so. The report does offer an export button: export by day and upload the file with Export uploaden. After that, impressions in AI is an ordinary tile with a trend and a comparison. A period with nothing uploaded stays empty and is never zero.
The layout the client sees
Section titled “The layout the client sees”The dashboard has Indeling bewerken (edit layout). In it you drag tiles, hide them (hidden tiles wait in a strip below), rename them per language, switch drilldowns on or off, choose the Standaardgrafiek (default chart) and hide a whole source with Tonen aan klant (show to client). Changes save immediately. This layout is what the client sees in the client portal.
Under Sleutelgebeurtenissen (key events) you give each GA4 event a name the client understands; the GA4 event name stays the reference. An event that has not come through yet can be added by its raw GA4 name.
Under Instellingen → Marketing → Namen van bronnen you give a source your own name. That name appears on the marketing page, on the client page and in the portal, including the sentences around it. Leave the field empty and a client in the portal reads a name with no vendor in it. A client also sees no links into Google and no colleagues.
Syncing
Section titled “Syncing”Every link carries a status: Gesynchroniseerd (synced), Eerste synchronisatie loopt (first sync running), Synchronisatiefout (sync error) or Verbinding verbroken (connection lost), with the date of the last sync. A nightly job pulls the daily figures and re-pulls the last week, because late figures are still being adjusted. For Google Ads that is thirty days: Google credits a conversion to the click’s day until the conversion window closes, so a month re-read for only a week compared unfinished conversions with a year-ago month that had long since settled. A new link also gets a one-off backfill of just over thirteen months, so sparklines and the year-over-year comparison are right from day one.
Unlinking does not delete the history: the link is deactivated, and linking the same property again switches it back on.
The assistant
Section titled “The assistant”The built-in assistant has six read tools for marketing: find a client, a client’s figures with
the compared span, the table behind a tile, what is linked and which source answers keyword
positions, the per-client digest and the cross-client grid. Each tool asks the same permission as
the screen, so the cross-client grid is only there for holders of marketing.overview.read. The
assistant cannot link or configure anything.
Permissions
Section titled “Permissions”| Permission | What it opens | Default roles |
|---|---|---|
marketing.metrics.read | View marketing metrics (panel, tab, portal tile) | Administrator, Member, Client |
marketing.link.manage | Manage marketing links and measurement profiles, and Instellingen → Marketing | Administrator |
marketing.overview.read | The cross-client marketing overview | Administrator |
Set these per role under Instellingen → Rollen (Settings → Roles).
Good to know
Section titled “Good to know”- A Google link syncs through one colleague’s account. When that connection drops, the screen names the person, so you know who to ask.
- A disabled API and an expired grant both come back as an error from Google, and they do not have the same cure. schakl. reads Google’s own reason out of the response: if the API is off in the Google Cloud project, reconnecting does not help and is deliberately not offered; if the scopes are missing, reconnecting is exactly the fix.
- Manager accounts (MCC) are expanded. Google only reports direct grants, so schakl. walks the hierarchy and offers the client accounts underneath. The manager account itself is never selectable, because Google refuses metric queries against one.
- Tag Manager is a connection, not a source. A container has no daily figures; the panel shows how many tags are live and how many changes are unpublished. See Google Tag Manager.
- An expired licence makes the module read-only: linking, unlinking and the settings refuse, and the nightly sync stands down. The panel, tab and overview keep showing the figures already collected.
Read next
Section titled “Read next”- Marketing sources: per source, what to prepare in Google and SE Ranking.
- Reporting: the monthly report built on these figures.
- Clients: the client record the panel sits on.